This was done as part of the Advanced Authentic Research program during the 2019-2020 academic school year.
Over 7 million students across the United States missed 15+ days of school in the 2015-16 school year (US Department of Education, 2012). These chronically absent who miss 10% of their academic year cause over 40 billion worth of instructional minutes to go to waste. Even more jarring, in the same report, it was cited that inconsistent student attendance is a better indicator than test scores to whether a student will drop out of school or not. In case it wasn't clear enough, student absenteeism is a major issue haunting the education system, and the need find a solution to it is greater than ever. Over the past 8 months, I have conducted a small series of experiments to try and alter the state of this issue in one public high school in Palo Alto, California.
Introduction
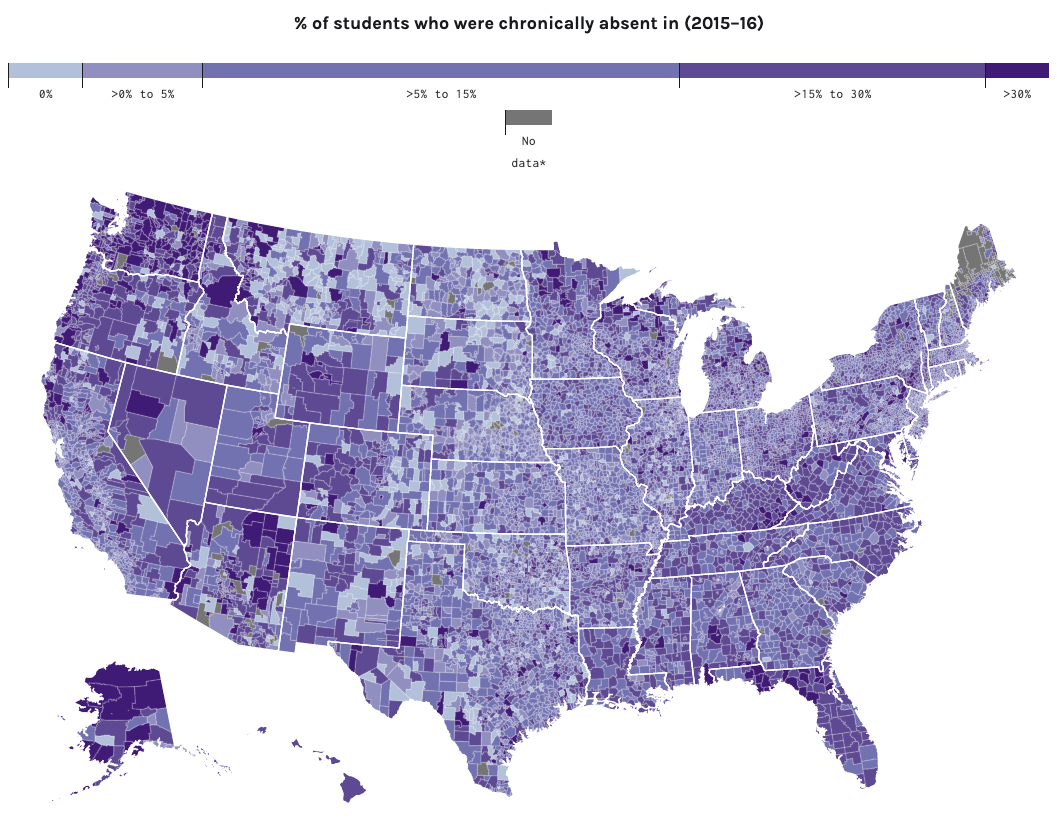
In the case of Palo Alto's Henry M. Gunn High School, only 5% of the school's 2000 students are in this category of the chronically absent. That means on average, 1 student is missing in every class on campus. What makes this statistic concerning though is when one considers the demographic of Palo Alto. Here are two maps of the United States: one of the median household income (New York Public Radio), and another of chronic absentee rates by district (US Department of Education, 2012).

|
|
Although Palo Alto is in one of the most affluent neighborhoods in the nation, its chronic absentee rate is equal to some areas with with not even half its median household income. This led to the idea that absenteeism may be fueled by different motivators across the country. For example, in some less fortunate neighborhoods, kids may be an active contributor to their family income, leading to conflicts with their academic commitment. Similarly, because of Palo Alto's wealth and greater access to resources, academic competitiveness may fuel absenteeism. This may seem counterintuitive at first: if someone wants to do well in class, why would they skip it? These strategic absentees skip class not because they want to, but rather as a necessary evil: they feel the need to skip a class a means to prepare for another one. These are the students that can most affect the absentee rate, as not only are they motivated to go to class, but their absences are likely more sporadic than they standard chronically absent, meaning that they are more likely to be in class to be influenced by a teacher or administrator, which nicely leads into the next section.
Nudges
Students can't be forced to go to class. Especially as Henry M. Gunn High School sports an open-campus policy, it is impossible to be able to force a substantial number of absentees to go to class beyond the already instated measures. So, instead, we tried to persuade the students, as if they agree for themselves attending class is the right thing to do, they are more likely to act on it. To do so, we used specially engineered social measures to try and convince the students as best as possible, known as nudges.
Nudges, at their core, are suggestions. They don't affect one's ability to choose, but they utilize the person's experience to guide them to pick an option. The most commonly used nudge utilizes comparisons: let's say a restaurant has a dish that doesn't sell super well, and is ultimately costing them money having it listed on the menu. To boost its sales, they can list a slightly cheaper dish that has no intention of actually being sold in large quantities. This "fake" dish provides a reference frame for the buyer, making what originally seemed as overprice as suddenly as a great deal. The first time this type of persuasion was first formalized in a book of the same name: Nudge: Improving Decisions About Health, Wealth, and Happiness, written by Cass Sunstein and Richard Thaler ( highly recommended read ). It should be reiterated that this doesn't change one's ability to pick what food item they want, and that's what makes a nudge so effective. It allows the person to convince themselves without needing to feel as if the choice was imposed on them (i.e. remove everything on the menu except one dish). This is a form of indirect persuasion: we're not explicitly saying what we want the affected person to do, but we are adding information to guide one choice over another. The counterpart to this would be direct persuasion: giving explicit desires for which option to choose.
Experimental Model
This project employed 2 types of persuasion tactics that were each disseminated via 2 types of mediums. The two types of mediums you are already familiar with: direct and indirect persuasion. This was examined by having the teacher give information by describing a set of data (see below) for direct persuasion. Indirect persuasion was tested by having the environment give the information, meaning instead of having the teacher give information on data, the students take in the information for themselves by noticing the data as a poster in the classroom. Now, I have been purposely vague about what data was shown to the students as there were actually two different sets of data that were shown to different classes, but they communicated the same idea.
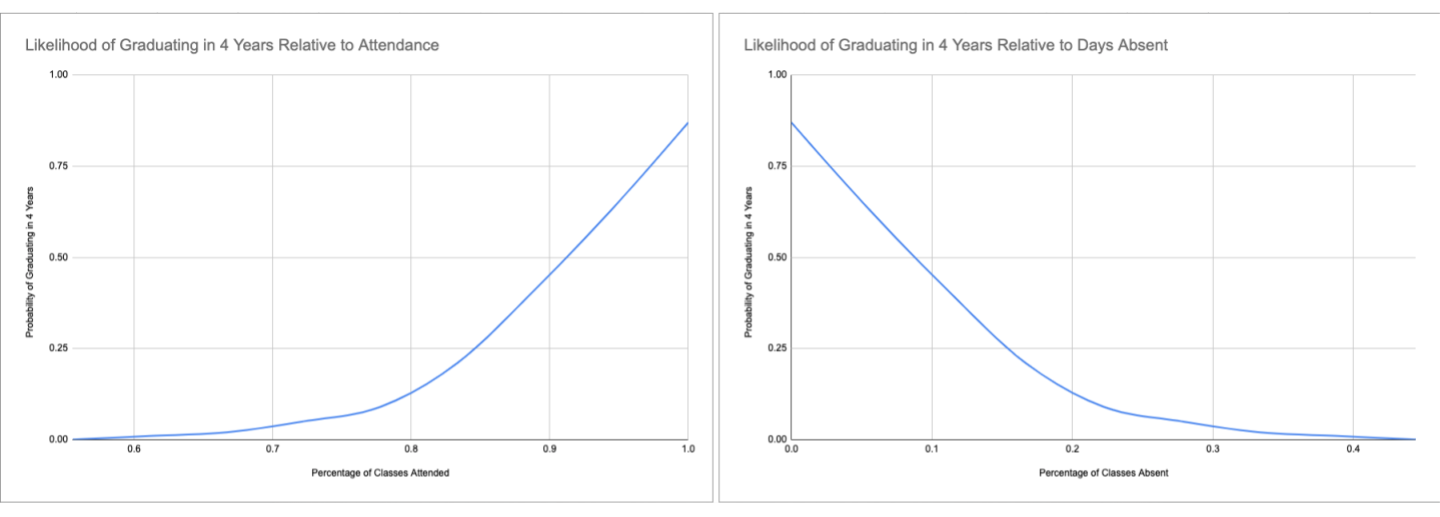
If these curves look the same, that's because they are; they are the same set of data, but one is presented with a positive connotation (attendance is good) and the other with a negative connotation (absenteeism is bad). These are the two sets of data presented, as to see whether how one presents data affects one's ability to influence.
So, in total, there are 5 classes: $\mathrm{i})$ teacher presents positive connotation data; $\mathrm{ii})$ teacher presents negative connotation data; $\mathrm{iii})$ classroom presents positive connotation data; $\mathrm{iv})$ classroom presents negative connotation data; and lastly, all compared to a $\mathrm{v})$ control with no intervention (this is formally known as framing)).
Results

As you can see, there are 5 lines shown on the graph: 4 lines, 2 blue and 2 red, to represent data collected and a green line that represents the aforementioned Gunn's 5% chronic absentee rate. The blue lines represent tardy and absentee data from January, to collect pre-experimental data. Red lines represent data collected in February, the month in which the experiment was set in motion.
This graph may be a bit intimidating to read, but it helps to realize that the x-axis is not a representation of time like most line graphs, but rather are the individual class models. This allows for easy comparison between months, as if there was, say, a virus moving throughout the classes that caused a 3% increase to absences to all classes, it will look as if one line was shifted upwards, having the same structure more or less to the other.
Analyses
These results are really surprising, as there was no improvement at all from any implementation of our stimulus. If anything, it got marginally worse with a slight increase to tardies in all classes ($\approx$3-4% increase). Which makes some sense as when you consider whenever someone commands you to do something or says you're doing something wrong, the first instinct is to disagree and defend your actions. This feeling is known as reactance, and it is likely what caused this mild increase in tardies.
What is extremely concerning however is the massive increase in absences seen in the "-/teacher" class (negative connotation data presented by teacher), which observed an astonishing 85% increase in absences. That is the difference between another 90 additional students absent in Gunn, and an additional 560 across all of the Palo Alto Unified School District. This incites an interesting thought: subconscious effects, such as reactance, can be amplified by other effects as well. In this case, it was the negativity bias -- the idea that negative connotations tend to be overestimated in their impact than positive ones -- that amplified the reactance. For instance, say you are an avid fan of the fruit, apples. If someone says oranges are better than apples, reactance will be incurred and you'll likely disagree. If someone says apples are worse than oranges, however, now there is this feeling of losing an opinion as well, amplifying the disagreement. Here, it is the difference between saying attending class is better than skipping it, and vice versa.
Conclusion
These results are highly specific. Before you try to go and apply these ideas beyond the realm of this project, you should consider who were subject to this experiment. In fact, I had witnessed this exact concept during my trials: the inspiration for an easy experimental model was inspired by Moore (2004), who conducted an almost identical scenario of my experiment and found it to be effective for university students, while mine showed to not be effective for high schoolers. Further testing is needed, but the greatest takeaway from this experiment is that communication and persuasion is something that can only be achieved when it is very specifically tailored for a specific audience.
If you want to read to a higher degree of depth on the matter, everything cited here and more can be found in my original paper.
Process
Originally, this project was never supposed to be about attendance. Originally, I was intending on studying voting theory as I was (and still am) super interested in how individual behavior affects the collective, and how that can be leveraged. I was looking at networks and graph theory, synchronization, and other related topics, but I was especially looking at behavioral economics and prospect theory. Realizing I was about a year too early to be able to study any recent elections or voting processes, I honed in on the behavioral economics aspect of the research, and started to look for a new problem to address. I talked to Gunn High School's principal on school issues that could be examined, and attendance was a recurring theme. This was only corroborated by the California Healthy Kids Survey, a questionnaire that surveyed 9th and 11th graders each year, and it reported that 7% of freshmen and 11% of juniors cut class to prepare for another class alone in the month the survey was distributed (California Department of Education, 2017-18). So, I started directing my attention to different studies and papers that were already conducted to learn what ideas have been tried and tested, such as what Moore (2004) and Self (2012) did.
Very quickly on, however, I realized I was probably going to have the same issue that I was going to have with voting theory: gathering original experimental data. Not that there is anything wrong with using pre-existing data, I personally wanted to collect my own original data to analyze, especially as I wasn't sure if something like attendance would be internalized the same way in a high school population as the more frequently studied college population (and as stated previously, there was in fact a discrepancy between Moore's and my findings due to different populations studied). So, I began reaching out to different teachers to see who would be willing to help run the experiment in their classes. Doing so proved to be very difficult, as I needed a teacher who taught at least 5 classes of 20+ students that had some absentees in each class, who also had the class time to be able to explain the necessary information to 2 classes. I was able to properly contact 2 teachers, one of which I was able to collect data for, and the other I was not due to the sudden COVID-19 outbreak.
Another thing that made this project difficult was that I had an incredible workload set out for this year. Between the 5 required academic classes, 2 electives, an after-school elective, club commitments, and a sport for two-thirds of the year, I just didn't have the time in my schedule to devote another 2+ hours of class time, which didn't even include time needed outside of class to research and write. Not to mention any extracurriculars I had in place as well. I had to schedule almost all of my meetings at 7am or earlier, or worse, do them entirely across email threads, which made communication ambiguous and difficult at times.
Regardless, this whole experience taught me so much about academia beyond the scope of what any high school classroom could have, and taught me how no matter no simple a question one has, willing to ask it can lead to incredible results.
About AAR
As stated at the top, this was done as part of the Advanced Authentic Research program that PAUSD provides to its two high schools as a means to introduce students to formal research and academic writing, well beyond what a standard English class essay or chemistry lab write-up teaches. Providing students with community mentors, experts, and connections, it fosters student growth via the students' own motivation to learn, creating an environment where projects, such as the former, can be created out of curiosity, and not by seeking a letter on a report card.